Overview
Welcome to the documentation area for the Omnistat project. Use the navigation links on the left-hand side of this page to access more information on installation and capabilities.
Browse Omnistat source code on Github
What is Omnistat?
Omnistat provides a set of utilities to aid cluster administrators or individual application developers to aggregate scale-out system metrics via low-overhead sampling across all hosts in a cluster or, alternatively on a subset of hosts associated with a specific user job. At its core, Omnistat was designed to aid collection of key telemetry from AMD Instinct™ accelerators (on a per-GPU basis). Relevant target metrics include:
GPU utilization
High-bandwidth memory (HBM) usage
GPU power
GPU temperature
GPU clock frequency
GPU memory clock frequency
Inventory information:
ROCm driver version
GPU type
GPU vBIOS version
Additional optional metrics:
RAS information (error counts per GPU block)
GPU power caps
GPU throttling events
Host network traffic (received/transmitted)
To enable scalable collection of these metrics, Omnistat provides a python-based Prometheus client that supplies instantaneous metric values on-demand for periodic polling by a companion Prometheus server (or a VictoriaMetrics server).
User-mode vs System-level monitoring
Omnistat utilities can be deployed with two primary use-cases in mind that differ based on the end-consumer and whether the user has administrative rights or not. The use cases are denoted as follows:
System-wide monitoring: requires administrative rights and is typically used to monitor all GPU hosts within a given cluster in a 24x7 mode of operation. Use this approach to support system-wide telemetry collection for all user workloads and optionally, provide job-level insights for systems running the SLURM, Flux, or PBS workload managers.
User-mode monitoring: does not require administrative rights and can be run entirely within user-space. This case is typically exercised by end application users running on production clusters under the auspices of a resource manager who want to gather telemetry data within a single job allocation. Frequently, this approach is performed entirely within a command-line
sshenvironment but Omnistat includes support for downloading data after a job for visualization with a dockerized Grafana environment. Alternatively, standalone query utilities can be used to summarize collected metrics at the conclusion of a job. Resource managers supported by user-mode Omnistat include both SLURM, Flux, and PBS.
To demonstrate the overall data collection architecture employed by Omnistat in these two modes of operation, the following diagrams highlight the data collector layout and life-cycle for both cases.
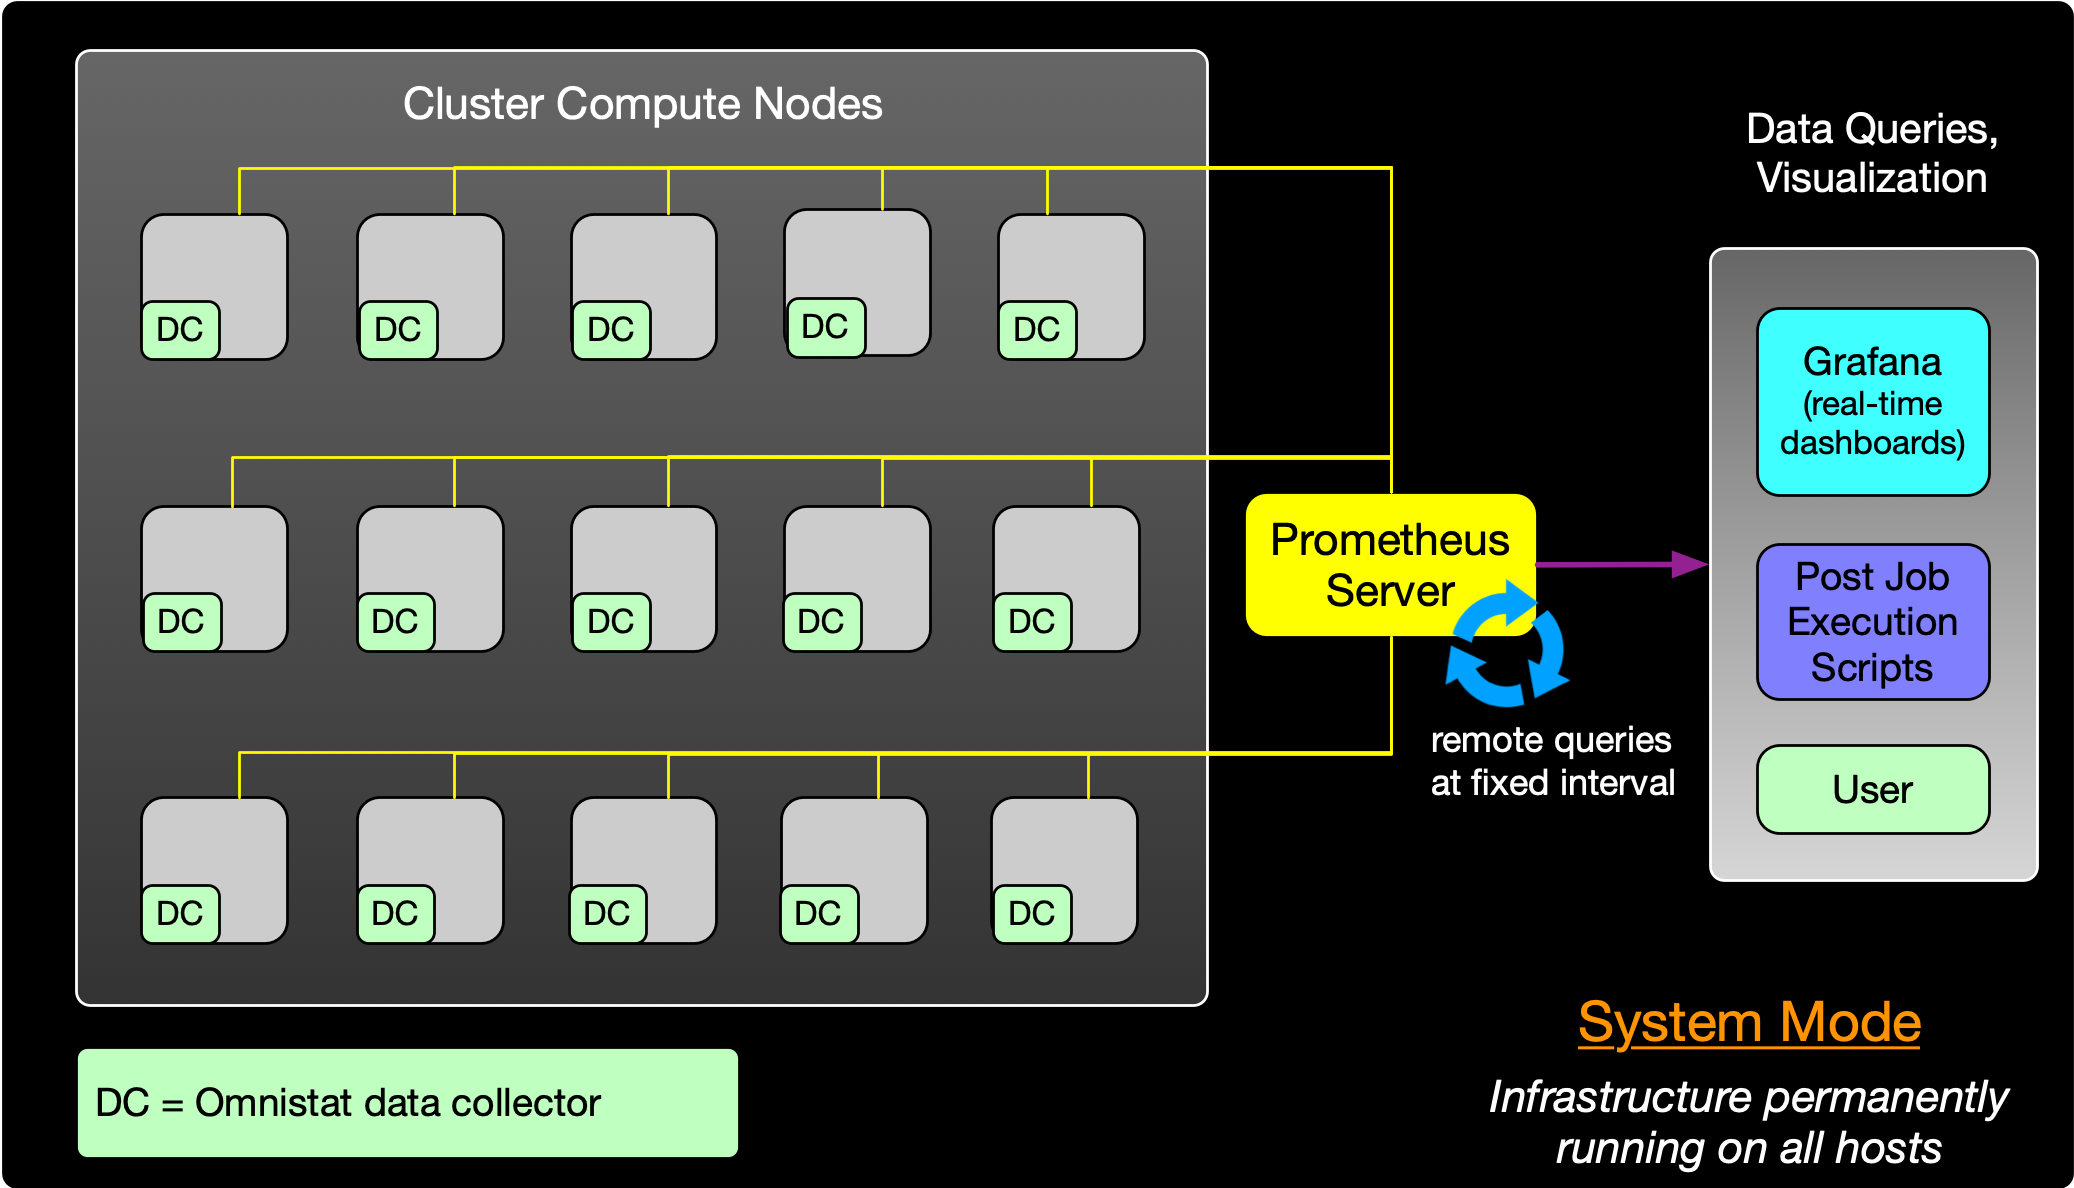
Figure 1 System-wide monitoring
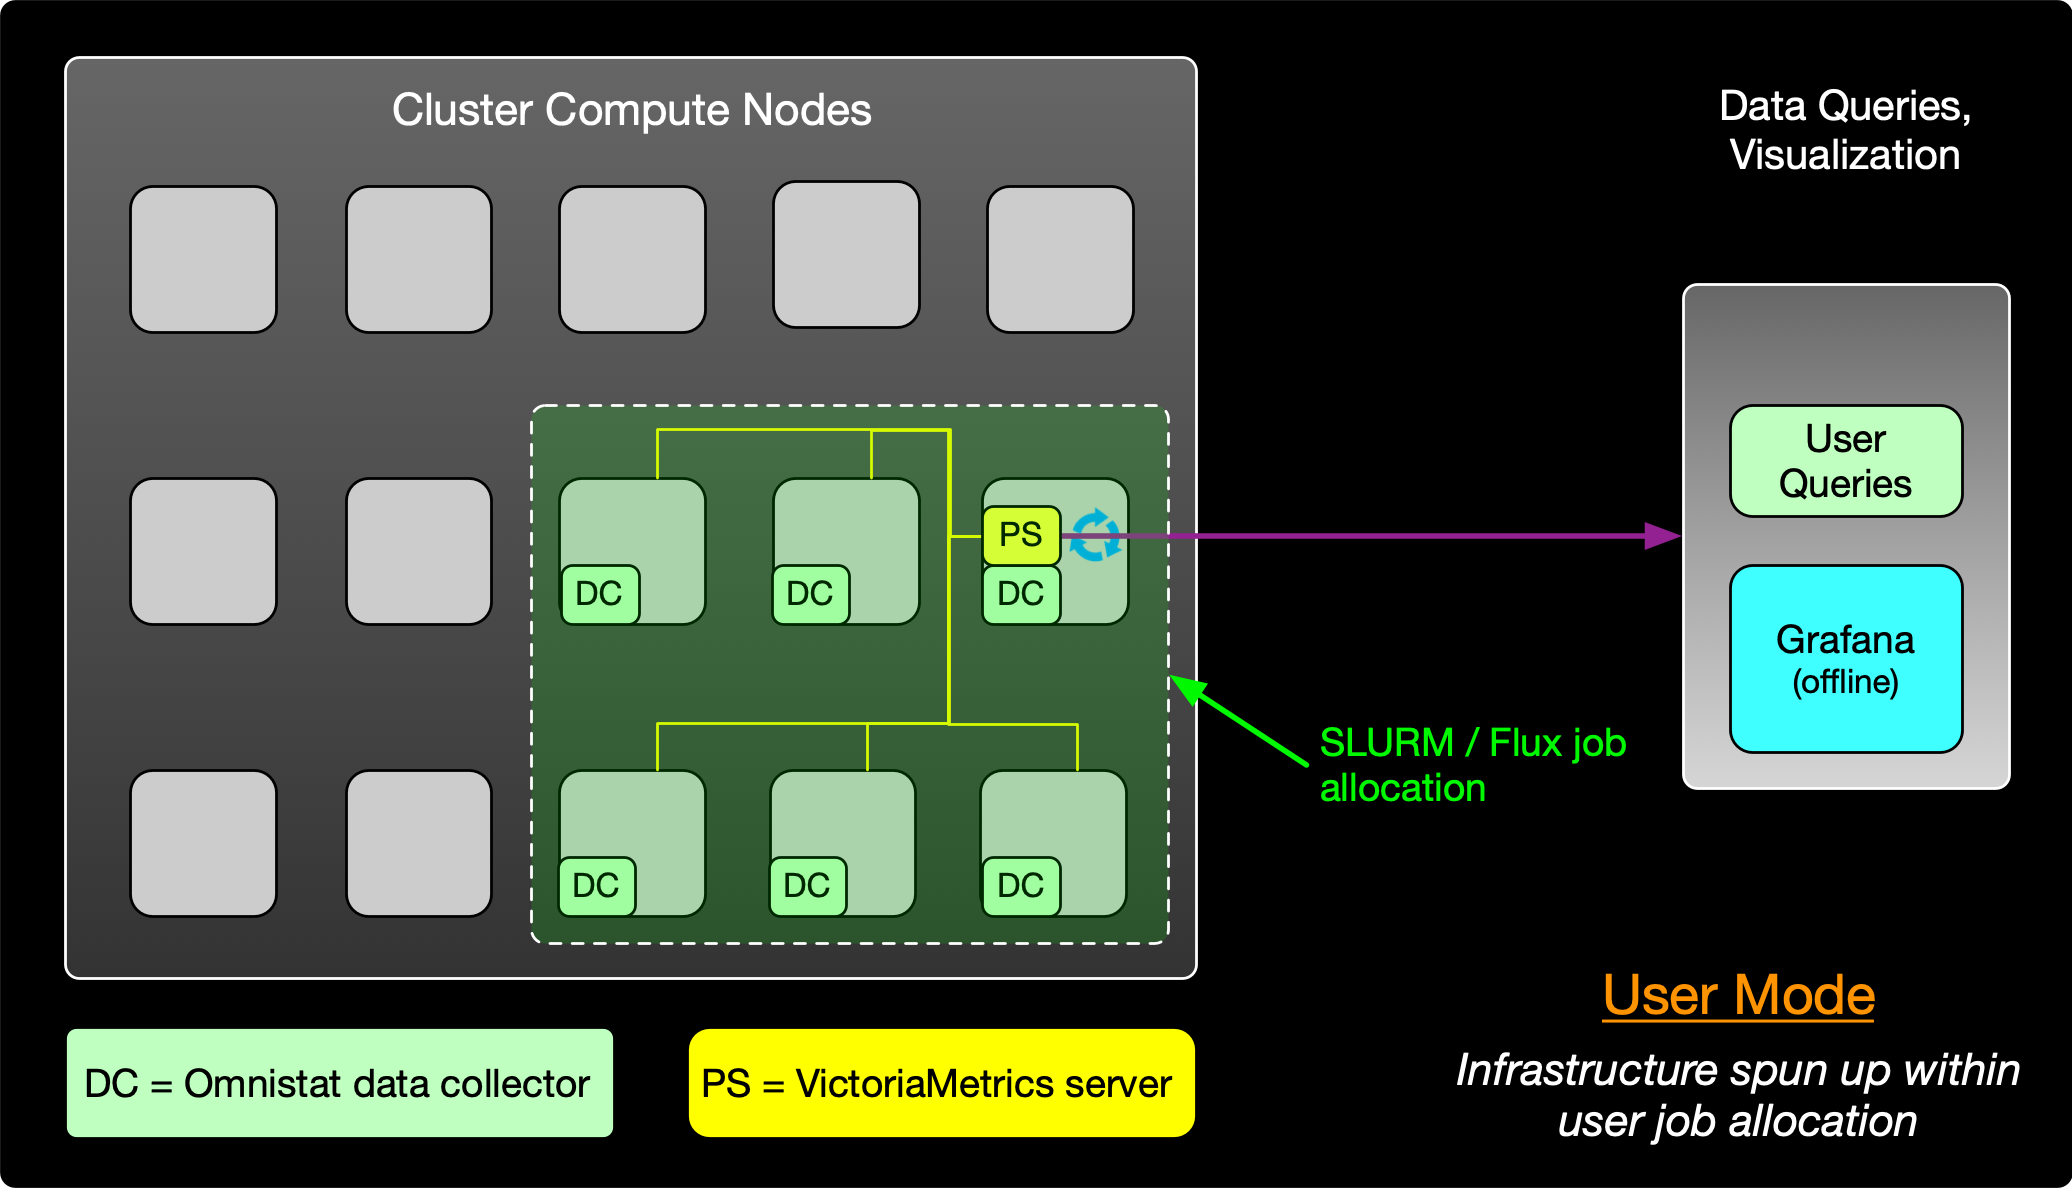
Figure 2 User-mode monitoring
In the system-wide monitoring case, a system administrator enables data collectors permanently on all relevant hosts within the cluster and configures a Prometheus server to periodically poll these nodes (e.g. at 1 minute or 5 minute intervals). The Prometheus server typically runs on the cluster head node (or separate administrative host) and does not require GPU resources locally. For real-time and historical queries, the system administrator also enables a Grafana instance that queries the Prometheus datastore to provide a variety of visualizations with collected data. Example visualization panels using this approach are highlighted in the Grafana section.
In addition to enabling GPU metrics collection in the system-wide monitoring case, sites may also wish to collect host-side metrics (CPU load, memory usage, etc). Other open-source Prometheus collectors exist for this purpose and we recommend enabling the node-exporter in combination with Omnistat.
Conversely, in the user-mode case, Omnistat data collector(s) and a companion VictoriaMetrics server are deployed temporarily on hosts assigned to a user’s job. At the end of the job, Omnistat utilities can query cached telemetry data to summarize GPU utilization details or it can be visualized offline after the job completes. An example command-line summary from this user-mode approach is highlighted as follows:
 ----------------------------------------
 Omnistat Report Card for Job # 44092
 ----------------------------------------

 Job Overview (Num Nodes = 1, Machine = Snazzy Cluster)
 --> Start time = 2024-05-17 10:14:00
 --> End   time = 2024-05-17 10:19:00

 GPU Statistics:

        | Utilization (%)  |  Memory Use (%)  | Temperature (C)  |    Power (W)     |
  GPU # |    Max     Mean  |    Max     Mean  |    Max     Mean  |    Max     Mean  |
 ------------------------------------------------------------------------------------
      0 |  100.00   55.56  |   95.09   63.40  |   61.00   52.89  |  300.00  177.67  |
      1 |  100.00   44.33  |   94.97   63.32  |   64.00   54.11  |  387.00  160.22  |
      2 |  100.00   55.56  |   94.92   63.28  |   60.00   51.11  |  304.00  176.78  |
      3 |  100.00   55.56  |   94.78   63.20  |   58.00   48.89  |  354.00  184.67  |

 --
 Query execution time = 0.1 secs
 Version = 1.5.1
Software dependencies
The basic minimum dependencies to enable data collection via Omnistat tools in user-mode are as follows:
ROCm (v6.3.0 or newer )
Python dependencies (see top-level requirements.txt)
System administrators wishing to deploy a system-wide GPU monitoring capability with near real-time visualization will also need one or more servers to host two additional services:
Grafana - either local instance or can also leverage cloud-based infrastructure
Prometheus server - used to periodically poll and aggregate data from multiple compute nodes
Resource Manager Integration
Omnistat can be optionally configured to map telemetry tracking to specific job Ids when using the popular SLURM resource manager or the new Flux framework. This is accomplished via enablement of a Prometheus info metric that tracks node-level job assignments and makes the following metadata available:
job id
username
partition name
number of nodes allocated
batch vs interactive job
Additional details on enabling this integration are discussed in the system-mode Installation section. In addition, job-oriented dashboards leveraging this feature are included in the companion Grafana discussion.